

New CPD-Accredited Certificate Course Teaches Professionals How to Turn Operational Data Into Visual Insights That Drive Improvement
Lean Six Sigma's power lies in its insistence on data. From DMAIC's Measure and Analyse phases to control charts and process capability studies, the methodology is built on the principle that decisions should be evidence-based. Yet one of the most persistent challenges facing process improvement professionals is not the absence of data — it is the difficulty of communicating what that data means. Spreadsheets full of numbers do not drive action. Clear, well-constructed visuals do. As organisations across manufacturing, healthcare, financial services, and the public sector embed Lean Six Sigma into their operations, the ability to translate analytical findings into compelling, accessible visuals has become an increasingly valued — and frequently underdeveloped — skill.
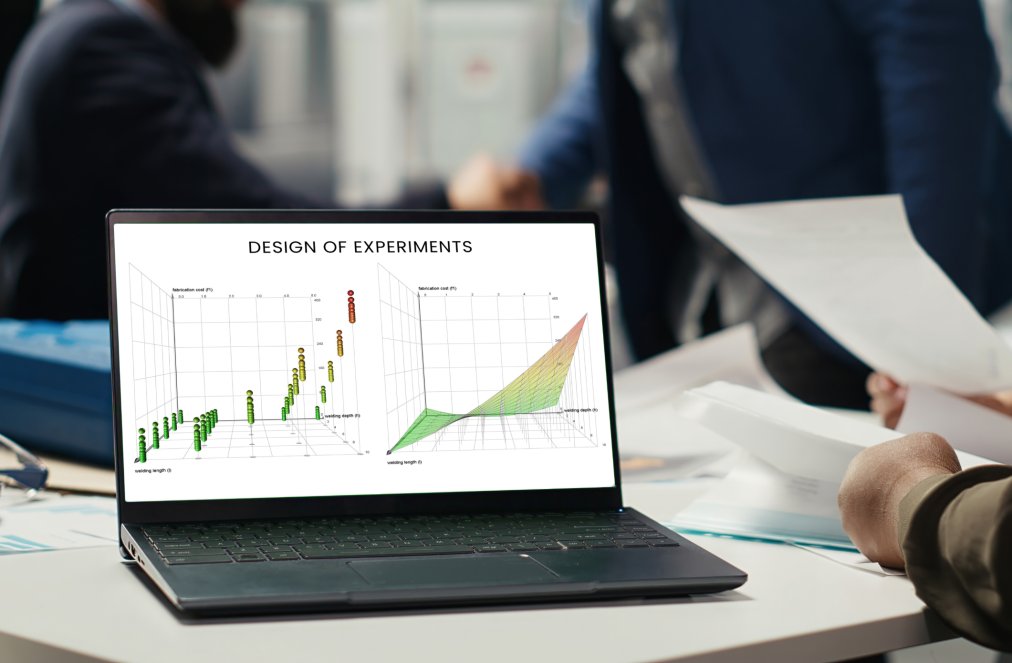
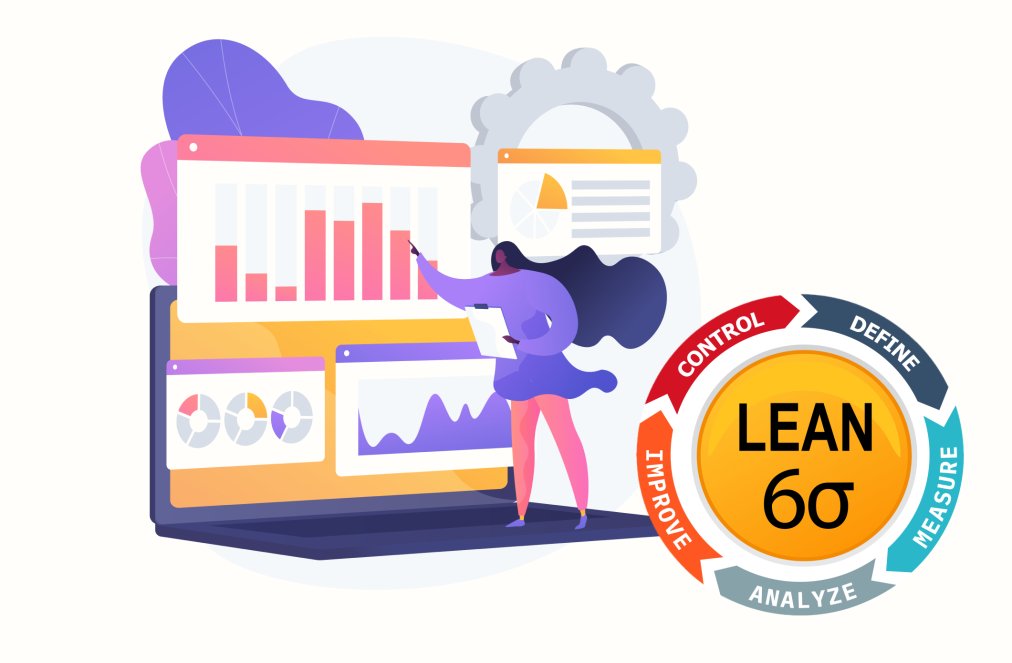
Alison, one of the world's largest free online learning platforms, is responding with the launch of its new Data Visualisation for Lean Six Sigma course. Free, CPD-accredited, and pitched at Intermediate level, the course equips Lean Six Sigma practitioners with the practical skills to build charts, dashboards, and reports that make process insights impossible to ignore.
From Raw Data to Reliable Insight
The course begins at the foundation: understanding where operational data comes from, how to structure it into clear and usable tables, and how to assess and correct data quality before any analysis begins. Learners work in Excel to calculate baseline process measures and compare results across different groups to identify variation — the starting point for any meaningful improvement.
Choosing and Building the Right Visualisations
With clean data in hand, the course turns to the question of which visual tells which story. Learners select chart types suited to specific process questions and build the visuals most commonly used in Lean Six Sigma work: Pareto charts for prioritising problems, trend charts for tracking performance over time, histograms for understanding distribution, and scatter charts for exploring relationships between variables. The course also covers how to set KPI targets and status thresholds clearly, and how to arrange dashboards and reports so that key findings surface immediately rather than getting buried.
Proving Improvement and Sustaining It
The final section addresses one of the most important moments in any improvement project: demonstrating that the change worked. Learners apply before-and-after visuals to show the impact of an intervention and build monitoring tools that keep that improvement visible over time — ensuring that process gains are sustained rather than quietly reversed.
Expert Review by a Lean Six Sigma Green Belt
The Data Visualisation for Lean Six Sigma course was reviewed by Danielle Verde Nolasco, a Business Process Specialist and Lean Six Sigma Green Belt with experience in process improvement, data analysis, and data visualisation. She focuses on turning complex data into clear, actionable insights that help teams understand performance, identify improvement opportunities, and make better-informed decisions — combining analytical thinking with practical process improvement and business-focused data visualisation.
"Data visualisation is becoming an increasingly important part of Lean Six Sigma. It's not only about analysing the data, but about making insights clear enough to drive action. This course helps learners build that connection between data, visual storytelling, and continuous improvement — developing skills that will only become more valuable as organisations become increasingly data-driven."
— Danielle Verde Nolasco, Business Process Specialist and Lean Six Sigma Green Belt
Mike Feerick, Founder and CEO of Alison, said:
"The whole point of Lean Six Sigma is to make better decisions based on evidence. But evidence only works if people can see it clearly. This course closes the gap between the analysis and the room — giving practitioners the visualisation skills to make their findings land, and to make the case for change."
Data Visualisation for Lean Six Sigma is free to access and CPD-accredited, with a certificate available to learners who successfully complete the course. It is suited to Lean Six Sigma practitioners at Yellow Belt and Green Belt level, process improvement professionals, operations managers, and anyone working with performance data who wants to communicate findings more effectively.
Enrol now at: https://alison.com/course/data-visualisation-for-lean-six-sigma
Ends
Media contact
For further information, contact the media team at [email protected].
About Alison
Alison is a global leader in free online learning and skills development. With over 50 million registered learners across 193 countries (as of October 2025), Alison empowers individuals, communities, and organisations to upskill quickly and effectively – at zero cost.
The Alison platform provides immediate access to over 6,000 free, CPD-accredited courses, covering essential areas such as Artificial Intelligence, Data Science, Cybersecurity, Digital Marketing, Project Management, Business Operations, Healthcare and Sustainability. Courses are created by a mix of independent experts and global leaders, including IBM, Stanford and Microsoft.
For organisations, Alison offers a Free Learning Management System (LMS) that enables unlimited learners to access thousands of courses with no upfront cost. A premium version with advanced analytics and customisation is also available. Alison's offering includes a full suite of assessments and psychometric tools, including a Workplace Personality Assessment, Mental Health & Wellbeing Assessment, English Language Proficiency Test, as well as Numerical, Verbal, and Abstract Reasoning tests.
To further support career development, learners also gain access to a Career Guide, a Resumé Builder, and the ability to study offline through the Alison App. The platform is also expanding its reach with multilingual versions, starting with complete Spanish, French, and Hindi offerings — reaffirming its mission to make education accessible to anyone, anywhere.
Founded in 2007, Alison pioneered the concept of free, large-scale online learning and is recognised as the world’s first MOOC (Massive Open Online Course) platform. Today, its mission continues: to break down barriers to learning, helping people gain skills, build confidence, and improve their lives — no matter where they live or what they earn.