No internet? No problem! Download any course on the Alison App and learn on the go. 📲 Download Courses &
Learn Without Internet Coming soon to iOS
Understanding the Essentials of Excel Data Visualization
Advanced Level

Understanding the Essentials of Excel Data Visualization

3,191Learners already enrolled
18
Not Interested
  • 1.5-3 Avg Hours
  • CPD Accredited
Start Learning

Understanding the Essentials of Excel Data Visualization

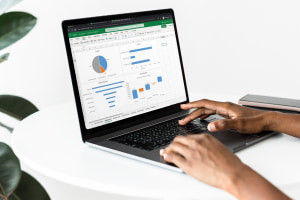
This free online course will show you how to turn data into storylines and display them in innovative Excel visuals.
Although the phrase "A picture is worth a thousand words" is almost a century old, its value still holds today. This is because visual information accounts for more than 90% of all data transmitted to the hum... Although the phrase "A picture is worth a thousand words" is almost a century old, its value still holds today. This is because visual information accounts for more than 90% of all data transmitted to the human brain. As a result, visual imagery is a powerful tool for communicating both abstract and tangible concepts. This course will show you how to make the best use of your data and findings by visually displaying them in Microsoft Excel.
COURSE PUBLISHER Jordan GoldmeierData visualisation & analytics expert

What You Will Learn In This Free Course

  • Define the concept of data visualiz...
  • Discuss the differences between Dat...
  • Explain the principles of data visu...
  • State the guidelines for tables and...
  • Define the concept of data visualization
  • Discuss the differences between Data graphics and infographics
  • Explain the principles of data visualization
  • State the guidelines for tables and charts
  • Describe the procedure of adding a developer tab and a camera tool
  • Outline the pros and cons of sparklines and heatmaps
  • Summarize the different types of KPI charts
  • Identify the process of creating infographics in Excel
  • Indicate the process of creating a Checkbox and a Tornado Drilldown Dashboard
View All Learning Outcomes View Less
Course Modules
Course Description
Alison Certificates
No internet? No problem! Download any course on the Alison App and learn on the go. 📲 Download Courses & Learn Without Internet Coming soon to iOS

Explore Careers Related To This Course

Data Analyst Data Analyst
Data Analysts are corporate detectives who examine the organisation’s data sets in minute detail, so their interpretations highlight critical patterns and trends in the business.

  • Average Salary Flag$67,856
  • Traits realistic investigative
Learn More
Tableau Specialist Tableau Specialist
When you are in a supermarket selecting something as simple and ordinary as a box of breakfast cereal, you might not realise that someone is observing, understanding, and analysing your choices. These

  • Average Salary Flag$80,738
  • Traits realistic investigative
Learn More

Complete This CPD Accredited Course & Get Your certificate!

  • Certify Your Skills
    A CPD accredited Alison Diploma/Certificate certifies the skills you’ve learned
  • Stand Out From The Crowd
    Add your Alison Certification to your resumé and stay ahead of the competition
  • Advance in Your Career
    Share your Alison Certification with potential employers to show off your skills and capabilities

Learner Reviews & Feedback For Understanding the Essentials of Excel Data Visualization

18
GEORGE REINHARD K. Alison Graduate
loved this course
This course teaches Excel-based data visualization, covering key tools, principles, and processes to create clear, audience-focused visuals like charts and KPIs, ideal for communicating insights effectively.
Was This Review Helpful?
Report
Joan J. J. Alison Graduate
loved this course
Very concise presentation on the essentials of data visualization. I learned a lot of Excel tricks that I never thought would have been possible.
Was This Review Helpful?
Report
Nadine Felecia 4 bedroom G. Alison Graduate
loved this course
This coursr help me to describe the procedure of adding a developer tab and a camera tool to outline the pros and cons of sparklines and heatmaps.
Was This Review Helpful?
Report
Warren M. Alison Graduate
loved this course
I got 100% on the understanding the Essentials of Excel Data Visualization course this morning.
Was This Review Helpful?
Report
Muhammad A. Alison Graduate
loved this course
Really easy to understand. Disclaimer: you cant fully follow the course using office.com , you would need an actual MS-Office Subscription
Was This Review Helpful?
Report
View 0 More Reviews
Back to course information

Want to create a customised learning path for your team?

Our dedicated Learning Advisors are here to help you curate a customised learning path tailored to your organisation's needs and goals.

Activate your Free LMS now Speak to Learning Advisor

Not sure where to begin? Or even what you want to do?

Discover the career most suitable for you and get started in the field with a step-by-step plan.

Get your Plan

About Your Alison Course Publisher

Jordan Goldmeier's Alison Stats

Jordan Goldmeier's Alison Stats

79,529 Learners8 Courses516 Learners Benefited From Their Courses