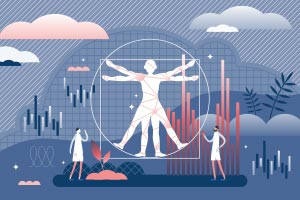
Biostatisticians play a unique role in protecting public health and improving people's lives. This course discusses the significance of plotting data to visualise variation or demonstrate relationships between variables. It begins by describing how statistics are used in data gathering, organisation, analysis, and interpretation. You will learn about various types of statistical studies as well as the process of selecting pre-arranged observations from a population in the form of a sample. In addition, you will also understand the importance of biostatistics in the development, implementation, and application of statistical methods in medical research. The concepts of descriptive and inferential statistics are then discussed. You explore the process of describing and making predictions from data. Additionally, the methods for summarising the characteristics of a data set in order to draw meaningful conclusions using statistical techniques are explained. Following that, you study the methods for calculating the values of the same and different units.
The next section deals with the main differences and the process of arithmetic and geometric calculation. Learn how to calculate the range, absolute mean, and standard deviation. In addition, you will study the process of determining the spread of data points from the centre using measures of variability. Following that, the procedure for calculating the standard error of the mean (SEM) is described. Discover the method of determining the deviations from the mean. You will also learn how to use the Z-score to calculate the chance of a score falling into a normal distribution and how to compare two scores from different normal distributions. Go on to see how to graphically display numerical group data based on quartiles using box plots. You will also discover how to use a box plot to show the form of distribution, as well as its central value and variability.
Finally, the concepts of moments, as well as the skewness of statistical distribution, are described. You will comprehend the significance of moments in studying a distribution's central tendency, dispersion, skewness, and kurtosis. Next, the process of using ‘skewness’ to measure the symmetry of distribution is explained. Discover how the variation of the distribution from the normal distribution can be measured by the skewness. Following that, you will explore how to use kurtosis to determine whether data is heavy-tailed or light-tailed in comparison to a normal distribution. In addition, you will learn how kurtosis helps in comprehending where the most information is hiding and how to analyse outliers in a given data set. Lastly, the course shows how to use the R programming language to perform a variety of statistical tasks such as data cleaning, analysis, and visualisation. It will help you understand how each form of data is processed, saved, and displayed within a device, as well as the implications for how it is used.
What You Will Learn In This Free Course
View All Learning Outcomes View Less All Alison courses are free to enrol, study, and complete. To successfully complete this Certificate course and become an Alison Graduate, you need to achieve 80% or higher in each course assessment.
Once you have completed this Certificate course, you have the option to acquire an official Certificate, which is a great way to share your achievement with the world.
Your Alison certificate is:
- Ideal for sharing with potential employers.
- Great for your CV, professional social media profiles, and job applications.
- An indication of your commitment to continuously learn, upskill, and achieve high results.
- An incentive for you to continue empowering yourself through lifelong learning.
Alison offers 2 types of Certificate for completed Certificate courses:
- Digital Certificate: a downloadable Certificate in PDF format immediately available to you when you complete your purchase.
- Physical Certificate: a physical version of your officially branded and security-marked Certificate
All Certificate are available to purchase through the Alison Shop. For more information on purchasing Alison Certificate, please visit our FAQs. If you decide not to purchase your Alison Certificate, you can still demonstrate your achievement by sharing your Learner Record or Learner Achievement Verification, both of which are accessible from your Account Settings.


 Avg. Hours
  Contains Video
  CPD Accredited
 Total XP:
 Knowledge & Skills You Will Learn


