This course introduces learners to the major concepts and tools for collecting, analyzing, and drawing conclusions from data. Do you want to learn the skills needed to explore data and make statistical inferences? This course takes you through the technology used in investigating, problem-solving and writing to build conceptual understanding. It is an excellent option for those who already possess adequate mathematical knowledge and quantitative reasoning ability. You will explore statistics through discussion and activities, and learn to design surveys and experiments. Study how to select the best methods for collecting or analyzing data. Patterns and trends are pretty common in statistics. Having the ability to describe patterns, trends, associations, and relationships in data is very useful in becoming a top-notch statistician. The course takes you through using probability and simulation to describe probability distributions and define uncertainty in statistical inferences. You will see how statistical reasoning can be used to draw appropriate conclusions and justify claims.
In addition, there are certain concepts that serve as the foundation of statistics. You will be introduced to data in real-world contexts. Variability in data suggests certain conclusions about its distribution but not all variation is meaningful. In this course, understand how statistics allows us to develop shared understandings of uncertainty and variation. Learners will be able to define and represent categorical and quantitative variables. You will describe and compare distributions of one-variable data and interpret statistical calculations to assess claims about individual data points or samples. Learn how to apply the normal distribution model in statistics. Having access to a world of data is meaningless without the ability to organize and analyze it. To develop these skills, learners will need multiple opportunities to interact with information presented in different formats. The course describes the patterns and characteristics that are seen in data and then compares the characteristics within the same set. Building on what they have learnt, learners explore relationships in two-variable categorical or quantitative datasets. You will be able to use graphical and numerical methods to investigate an association between two categorical variables. You will be able to describe form, direction, strength, and unusual features for an association between two quantitative variables.
Depending on how data are collected, we may or may not be able to generalize findings or establish evidence of causal relationships. Learn the important principles of sampling and experimental design in this course. Probabilistic reasoning allows statisticians to quantify the likelihood of random events over the long run and to make statistical inferences. You will be able to discuss simulations and abstract calculations of probability, and build on your understanding of simulated or empirical data distributions. Next you will be taken through the fundamental principles of probability used to represent, interpret, and calculate parameters for theoretical probability distributions for discrete random variables. The course describes probabilistic reasoning to sampling, introducing learners to sampling distributions of statistics used in performing inferences. You will get to know how sample statistics can be used to estimate corresponding population parameters, measures of centre (mean) and variability (standard deviation). See how sampling distributions can be determined directly from population parameters. The course further examines by examining the various tools of data visualization, which is one of the two main ways of condensing datasets and creating consumable results. You will be taken through the several advantages of using metrics as a method of data interpretation. Are you preparing for advanced coursework in statistics or other fields using statistical reasoning? Then start this course today.
What You Will Learn In This Free Course
View All Learning Outcomes View Less All Alison courses are free to enrol, study, and complete. To successfully complete this Diploma course and become an Alison Graduate, you need to achieve 80% or higher in each course assessment.
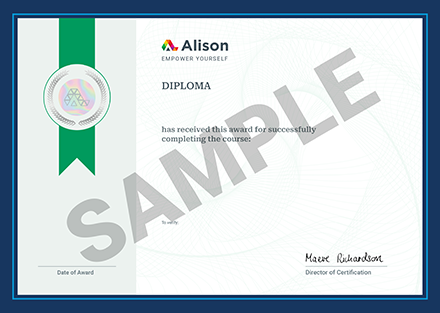
Once you have completed this Diploma course, you have the option to acquire an official Diploma, which is a great way to share your achievement with the world.
Your Alison certificate is:
- Ideal for sharing with potential employers.
- Great for your CV, professional social media profiles, and job applications.
- An indication of your commitment to continuously learn, upskill, and achieve high results.
- An incentive for you to continue empowering yourself through lifelong learning.
Alison offers 2 types of Diploma for completed Diploma courses:
- Digital Diploma: a downloadable Diploma in PDF format immediately available to you when you complete your purchase.
- Physical Diploma: a physical version of your officially branded and security-marked Diploma
All Diplomas are available to purchase through the Alison Shop. For more information on purchasing Alison Diploma, please visit our FAQs. If you decide not to purchase your Alison Diploma, you can still demonstrate your achievement by sharing your Learner Record or Learner Achievement Verification, both of which are accessible from your Account Settings.


 Avg. Hours
  Contains Video
  CPD Accredited
 Total XP:
 Knowledge & Skills You Will Learn


