This course provides valuable insights into the concepts and properties of exponential functions. Learn how to solve various kinds of exponential equations either algebraically or graphically. It also explains the concept of functions, domain and the range of a function in algebra. By completing the modules, you will be able to recognize special functions and how they form their equations. You will also learn how to identify the domain and range of functions as well as how to draw their graphs. This course teaches you the process of identifying linear functions in algebra. You will further learn about the different ways linear functions can be expressed along with the formula for calculating linear equations. You will be introduced to the processes involved in graphing quadratic functions as well as how to get the highest point of the parabola.
Did you know that arithmetic operations such as addition, subtraction, multiplication, and division can be performed on a function? You will be introduced to the graphical transformation of functions in algebra, which covers how to analyze a function as a modification of a basic prototype as well as identifying the different types of graphical transformations. This course also teaches you the meaning and application of dilation to the conversion of figures in mathematics. You will then learn about the different properties preserved under a dilation and how to map the dilation equation. Expand your knowledge on the functions of patterns in algebra as well as how a sequence is defined by a recursive formula. You will also be able to identify the vocabulary associated with finite sequences.
Finally, this course explains the functions of the measure of central tendency in mathematics. Learn about the importance of the entire set of data in a single statement including the different types of measures of central tendency. The material breaks down the various ways data are displayed including bar charts, dot-frequency graphs and linear interpolation. Upon the successful completion of this course, you will be able to interpret and construct frequency tables using histograms, picture graphs, and polygons. You will also be able to explore the concept of correlation, which deals with the relationships between data sets. This course is targeted at algebra students: registration and completion are free and there are no subscription fees to maintain your Alison account!
What You Will Learn In This Free Course
View All Learning Outcomes View Less All Alison courses are free to enrol, study, and complete. To successfully complete this Certificate course and become an Alison Graduate, you need to achieve 80% or higher in each course assessment.
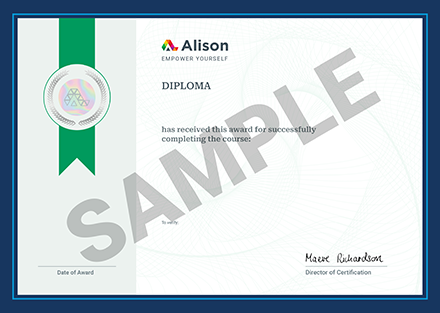
Once you have completed this Certificate course, you have the option to acquire an official Certificate, which is a great way to share your achievement with the world.
Your Alison certificate is:
- Ideal for sharing with potential employers.
- Great for your CV, professional social media profiles, and job applications.
- An indication of your commitment to continuously learn, upskill, and achieve high results.
- An incentive for you to continue empowering yourself through lifelong learning.
Alison offers 2 types of Certificate for completed Certificate courses:
- Digital Certificate: a downloadable Certificate in PDF format immediately available to you when you complete your purchase.
- Physical Certificate: a physical version of your officially branded and security-marked Certificate
All Certificate are available to purchase through the Alison Shop. For more information on purchasing Alison Certificate, please visit our FAQs. If you decide not to purchase your Alison Certificate, you can still demonstrate your achievement by sharing your Learner Record or Learner Achievement Verification, both of which are accessible from your Account Settings.


 Avg. Hours
  Contains Video
  CPD Accredited
 Total XP:
 Knowledge & Skills You Will Learn


